Introduction
Close surveillance of the patient infected with HIV is needed to detect any change indicative of progression of the infec-tion, and, at the right moment, begin or modify clinical inter-ventions, as could be HAAR T. As HIV infection have a pe-riod of time when the patient has not any clinical symptom, some other indicators, known as surrogate markers, are used to know the stage of the infection at any given moment. Viral load and T cell subsets are two parameters widely used to ful-fill this purpose (1). Expression of molecules associated with T cell activation (CD38, HLA-Dr, CD95) are used too, and so, level of apoptosis of these T cells (2,3).
Glycoprotein 120 (gp I20) is a structural molecule of HIV’s en-velope. It have a very important function in HIV infection, at-taching virus to CD4 and CXCR4 molecules in the membrane of CD4+ T cells, so virus could invade cell. Cells infected with HIV can produce and release soluble gp 120 (4), and it had been detected in serum of AIDS patients (5). During infection patients produce anti-gpl20 antibodies. Several studies had shown that interaction of gp120, independent of viral particle, with CD4 and CXCR4 receptors in the membrane of T cells mediate a rapid cell death, with apoptotic characteristics (6,7). A slower apoptotic effect could be seen too: crosslinking CD4 with gp120 and anti-gpl20 antibodies cause characteristic DNA fragmenta-tion after CD3 stimulation (8). In lymph nodes of infected pa-tients, gp120 was present in the plasma membrane of apoptotic CD4+ T cells (9). All these findings interested us in study ex-pression of gp 120 in peripheral blood CD4+ T cells, as a marker of susceptibility of these cells to suffer the deleterious effects observed in vitro, and, eventually, as a surrogate marker of dis-ease progression. To do the test in peripheral blood had the ad-vantage of the easy obtaining of the sample, so the test could be do as a routine procedure, and to use flow cytometry as the method, let us save time and expenses, facts specially important in a limited resources environment.
Materials and methods
Patients: Ninety seven patients (74 men and 23 women) infected with HIV-l, were received in our laboratory, Bio Cell, in Caracas, and studied as a part of their surveillance and treatment program Staging of infection was achieved according to CDC’ s classifi-cation system (10). The median age of patients was 34.9 ± 12.4 years. Thirty patients were attended before they received any antiretroviral therapy (Group of Naïve Patients) and sixty-seven were under HAART (Group of Treated Patients), following a protocol which include two nucleoside analogs inhibitors or re-verse transcriptase (lamivudine and stavudine) and a combina-tion of two protease inhibitors (lopinavir and ritonavir). These patients had received this antiretroviral treatment for 8.7 ± 4.4 months by the moment this study was made.
Controls: Twenty volunteer individual s served as controls. They were asymptomatic, with serology negative to HIV infection and with similar characteristics to patients in age and gender.
Samples: 10 ml. of whole blood was drawn for each patient and control, and it was mixed with EDTA.
Flow cytometry determinations: 50).11. of EDTA whole blood were mixed, in several combinations, with 5 ).11 of the respective monoclonal antibodies, and incubated for 15 min-utes, at room temperature, protected from light. After incuba-tion, 2 ml. of lysing solution was added to test tubes, mixed, and incubated for 15 minutes. Test tubes were centrifuged at 1.500 rpm, for 5 minutes. Supenatant was discarded and pellet was mixed with 200 01 of PBS. Then samples were acquired in a F ACScan flow cytometer (Becton Dickinson), 10.000 events were saved and analyzed by Cell Quest and/or Pain-a-Gate Pro (Becton Dickinson). Isotypic controls were used to set cut-off, especially for molecules of weak expression, as gp120. In this work we considered as positive to expression of CD95 only cells with “high expression” (CD95 high). Expression of molecules was reported as percentage of positive cells in a given subset. Monoclonal antibodies used were antiFITC (ImmunoDiagnostics Inc., Wobum, MA); anti-CD95-PE, anti-FITC and anti-CD4-PC5 (Inmunotech, France); anti-CD8-FITC, antiiCD38-RPE and anti-CD4-FITC/anti-CD45RA-RPE (Dako A/S, Denmark). Isotypic control monoclonal antibodies used were mouse IgG 11RDl/ mouse IgGI-FITC (Beckman-Coulter, Miami, FL), mouse IgGllPC5 (Immunotech, France) and mouse IgGI-FITC (Dako A/S, Dennmark).
Viral load determinations: It was determined using Amplicor-HIV-I-Monitor (Roche Diagnostic System), following instruc-tions of the commercial kit.
Statistics: Data were analyzed using Graph Pad Prism (Graph Pad Software Inc., San Diego, CA). For determination of differ-ences between groups Mann- Whitney U test was used, and for determination of correlation between parameters Spearman test was used.
Results
Expression of gp 120 in CD4+ T cells was 1.14 ± 1.77 % in the group of naüve patients and 0.65 ± 0.57 % in the group of treated patients.
In the group of naüve patients we found that expression of gp 120 had a positive statistically significant correlation with expression of CD95 in CD4+ T lymphocytes (p=0.0409). The patients with higher percentages of expression of gp 120 had higher percentages of expression of CD95 in CD4+ T cells (Graph 1).
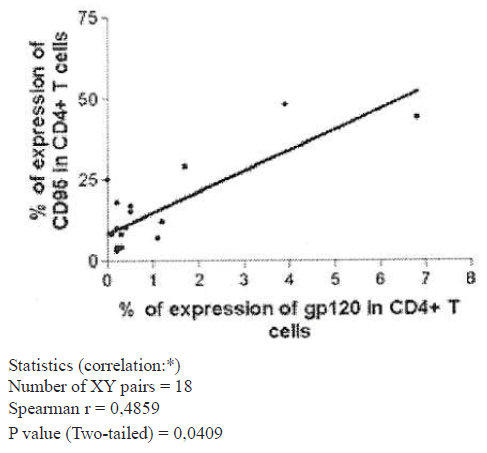
Graph 1. Expression of gp 120 and CD95 in CD4+T cells (Group of naive patients).
In the group of naüve patients, individuals with percentages of expression of gp120 higher than 1.5 % had low percentages and absolute values of CD4+ T lymphocytes (Graphs 2 and 3), and there were negative statistical1y significant correlations be-tween these parameters (p=0.0183 and p=0.0165, respectively). Nevertheless not al1 patients with low levels of CD4+ T cel1s had high percentages of expression of gp120. Also, there were negative statistical1y significant correlation (p=0.0126) between expression of gp 120 and percentage of expression of CD45RA (naüve cel1s) in CD4+ T cel1s (Graph 4).
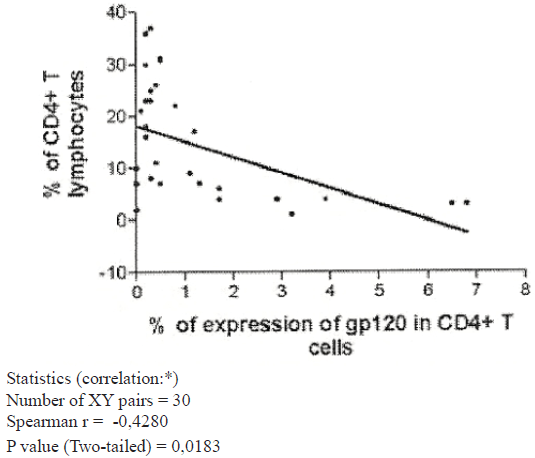
Graph 2. Expression of gp 120 % of CD4 T cells (Group of naive patients).
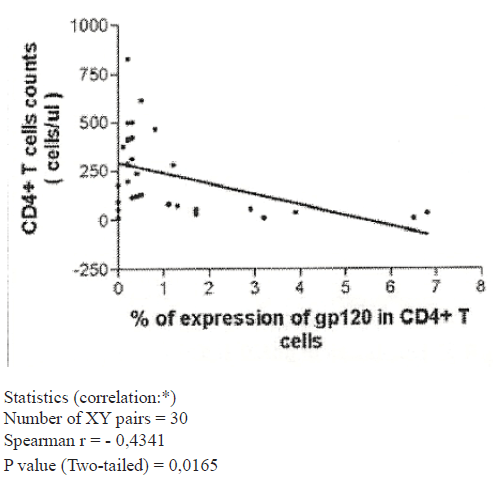
Graph 3. Expression of gp 120 and CD4+T cells ( /ul) (Group of naive patients).
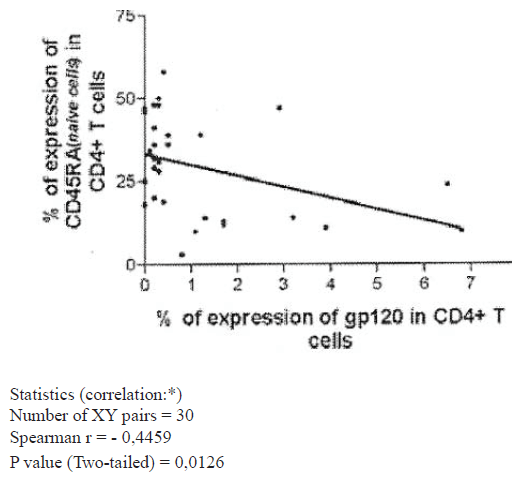
Graph 4. Naive CD4+ T cells and expression of gp 120 (Group of naive patients).
Other relevant strong negative statistical1y significant corre-lations observed, both in naüve and treated patients, were be-tween CD95 expression in CD4+ T cel1s and percentage and absolute values of these CD4+ T cel1s, with p values of 0.0009 and 0.0054 in naüve patients, and 0.004 and 0.0003 in treated patients, respectively (Graphs 5 and 6, as respectatives).
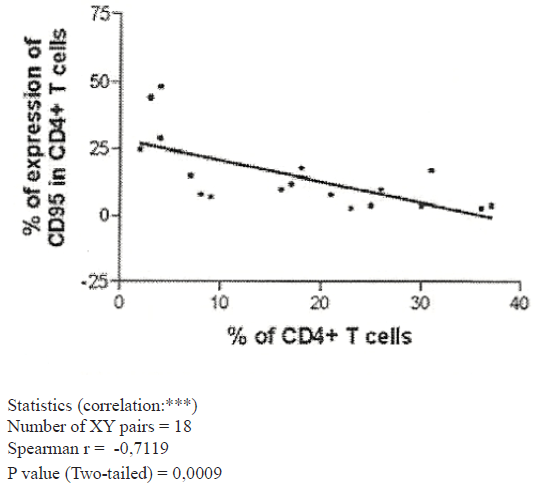
Graph 5. CD95 and % of CD4+ T cells (Group of naive patients).
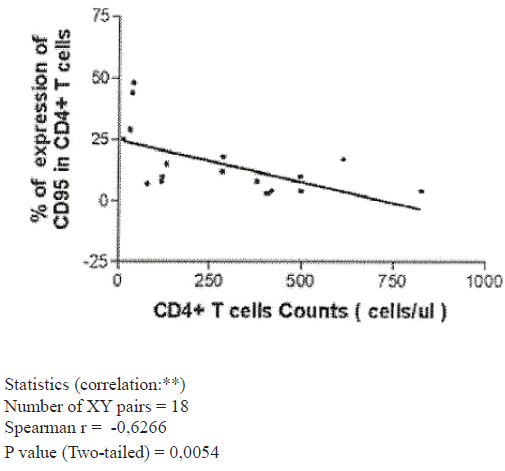
Graph 6. CD95 and CD4+ T cells Counts (Group of naive patients).
When the group of treated patients was analyzed, no correla-tions between expression of gp120 and other parameters were observed.
Conclusions
Taking account the deleterious effect that gp120 has in CD4+ T cells (6-9), it was not a surprise to found a negative correla-tion between expression of gp120 and level of CD4+ T cells in naüve patients. Nevertheless not all patients with low levels of CD4+ T cells had high expression of gp120. So, we can think in other causes of T cell destruction, as could be tat pro-tein (11), or other deleterious effects of HIV infection. On the other hand, it is possible that gp120 attach a cell, induce an apoptotic effect and leave this cell to join another. So, at any given moment not all cells affected by interaction with gp120 will dissplay this molecule in its membrane. It is relevant that higher expression of gp120 is associated with lower levels of naüve CD4+ T cells (Graph 4), that could mean that this is a more susceptible subset to gp120.
Considering what high expression of CD95 means to suscep-tibility of a cell to suffer apoptosis (12), and the association observed between CD95 and HIV infection (13, 14), is so rel-evant the correlation observed between CD95 and gp120 ex-pressions in CD4+ T cells in naüve patients.
In the group of patients studied, when HAAR T is initiated, we observed a rapid fall in viral load levels, but a slower recu-peration of CD4+ T lymphocyte population. So, in this group level of CD4+ T cells.
Is not any more a good surrogate marker of progression to disease, at least in the first moment, after beginning HAART. This could explain why expression of gp120, which is corre-lated with CD4+ T lymphocyte population, has not correla-tion with any other surrogate marker in patients under HAART.
It is relevant that 92% of the patients (naüve and treated) with expression of gp120 > 1.5 % had one or more of the following features: viral load;³180.000 copies/ml; CD4+ T lymphocytes £157 /μl or specific AIDS symptoms. But only 12 % of all evaluated patients had expression of gp120 1.5 %. Other dis-advantage is that those patients under HAART with viral load levels ³ 10.800 copies/ml (suggestive of any fail in antiretroviral therapy) had low levels of expression of gp120 (<1.5 %).
We conclude that, although expression of gp120 in peripheral blood CD4+ T lymphocytes had good correlations with known surrogate markers in naüve patients, its low level of expres-sion, and the fact that no correlation was observed in patients under HAART, limits its use as an independent surrogate marker.
References
- Wong MT, Dolan Ml, Koslow E, et al: Patterns of virus burden and T cell phenotype are estab1ished early and are correlated with the rate of disease progression in human immunodeficiency virus infected persons. J Infect Dis, 1996;173:877-888.
- Bentwich Z, Kalinkovich A, Weisman Z, Grassman Z: Immune activation in the contex of HIV infection. Clin Exp Immuno1, 1998;111: 1-2.
- Bad1ey AD, Parato K, Cameron DW, et al: Dynamic corre1ation of apoptosis and immune activation during treatment of HIV infection. Cell Death Differ, 1999; 6:420-432.
- Py1e SW, Bess JWJ, Robey WG, et al: Purification of envelope glycoprotein from cu1ture fluids of human immunodeficiency virus (HIV)-infected H9 cells. AIDS Res Hum Retroviruses, 1987;3:387-400
- Oh, SK, Cruikshank WW, Raina J, et al: Identification of HIV-l envelope glycoprotein in the serum of AIDS and ARC pa-tients. 1 AIDS, 1992;5:251-256.
- Roggero R, Robert-Hebmann V, Harrington S, et al: Binding of Human Immunodeficiency Virus Type 1 gp120 to CXCR4 induces mitochondria1 transmembrane depolarization and citochromo c-mediated apoptosis independently of Fas signal-ing. 1 Viro1, 2001;75: 7637-7650.
- Berndt C, Mopps B, Angermuller S, et al: CXCR4 and CD4 mediate a rapid CD95-independent cell death in CD4+ T cells. Prac Natl Acad Sci USA, 1998;95:12556-15561.
- Banda NK, Bernier l, Kurahara DK, et al: Crasslinking CD4 by Human Immunodeficiency Virus gp120 prime s T cell for activation-induced apoptosis. 1 Exp Med, 1992;176: 1099-1106.
- Sunila 1, Vaccarezza M, Pantaleo G, et al: gpl20 is present in the plasma membrane of apoptotic CD4 cells prepared from lymph nodes of HIV infected individuals: An immunoelectron microscopic study. AIDS, 1997;11:27732.
- 993 revised CDC HIV Classification System and Expanded AIDS Surveillance Definition for Adolescents and Adults. MMWR, 1992;41(RR-17): 1-19.
- Westendorp MO, Frank R, Oschsenbauer C, et al: Sensitiza-tion of T cells to CD95-mediated apoptosis by HIV-l Tat and gp120. Nature, 1995;375:4977500.
- Krammer PH: CD95’s deadly mission in the immune system. Nature, 2000;407: 789-795.
- Bohler T, Baumler C, Herr 1, et al: Activation of the CD95 system increases with disease progression in human immuno-deficiency virus type l-infected children and adolescents. Pediatr Infect Dis J, 1997;16:754-759.
- Gougeon ML, Lecouer H, Dulioust A, et al: Programmed cell death in peripheral lymphocytes from HIV -infected persons. Increased susceptibility to apoptosis of CD4 and CD8 T cells correlates with lymphocyte activation and with disease progres-sion. J Immnunol, 1996;156:3509-3520.